Free SPC Software & Control Chart Generator
X-bar R, X-bar S, I-MR, P, NP, C and U control charts with auto control limits, Western Electric and Nelson rules detection, Cpk/Ppk process capability and a full Gage R&R study — in your browser, no signup, no monthly fee.
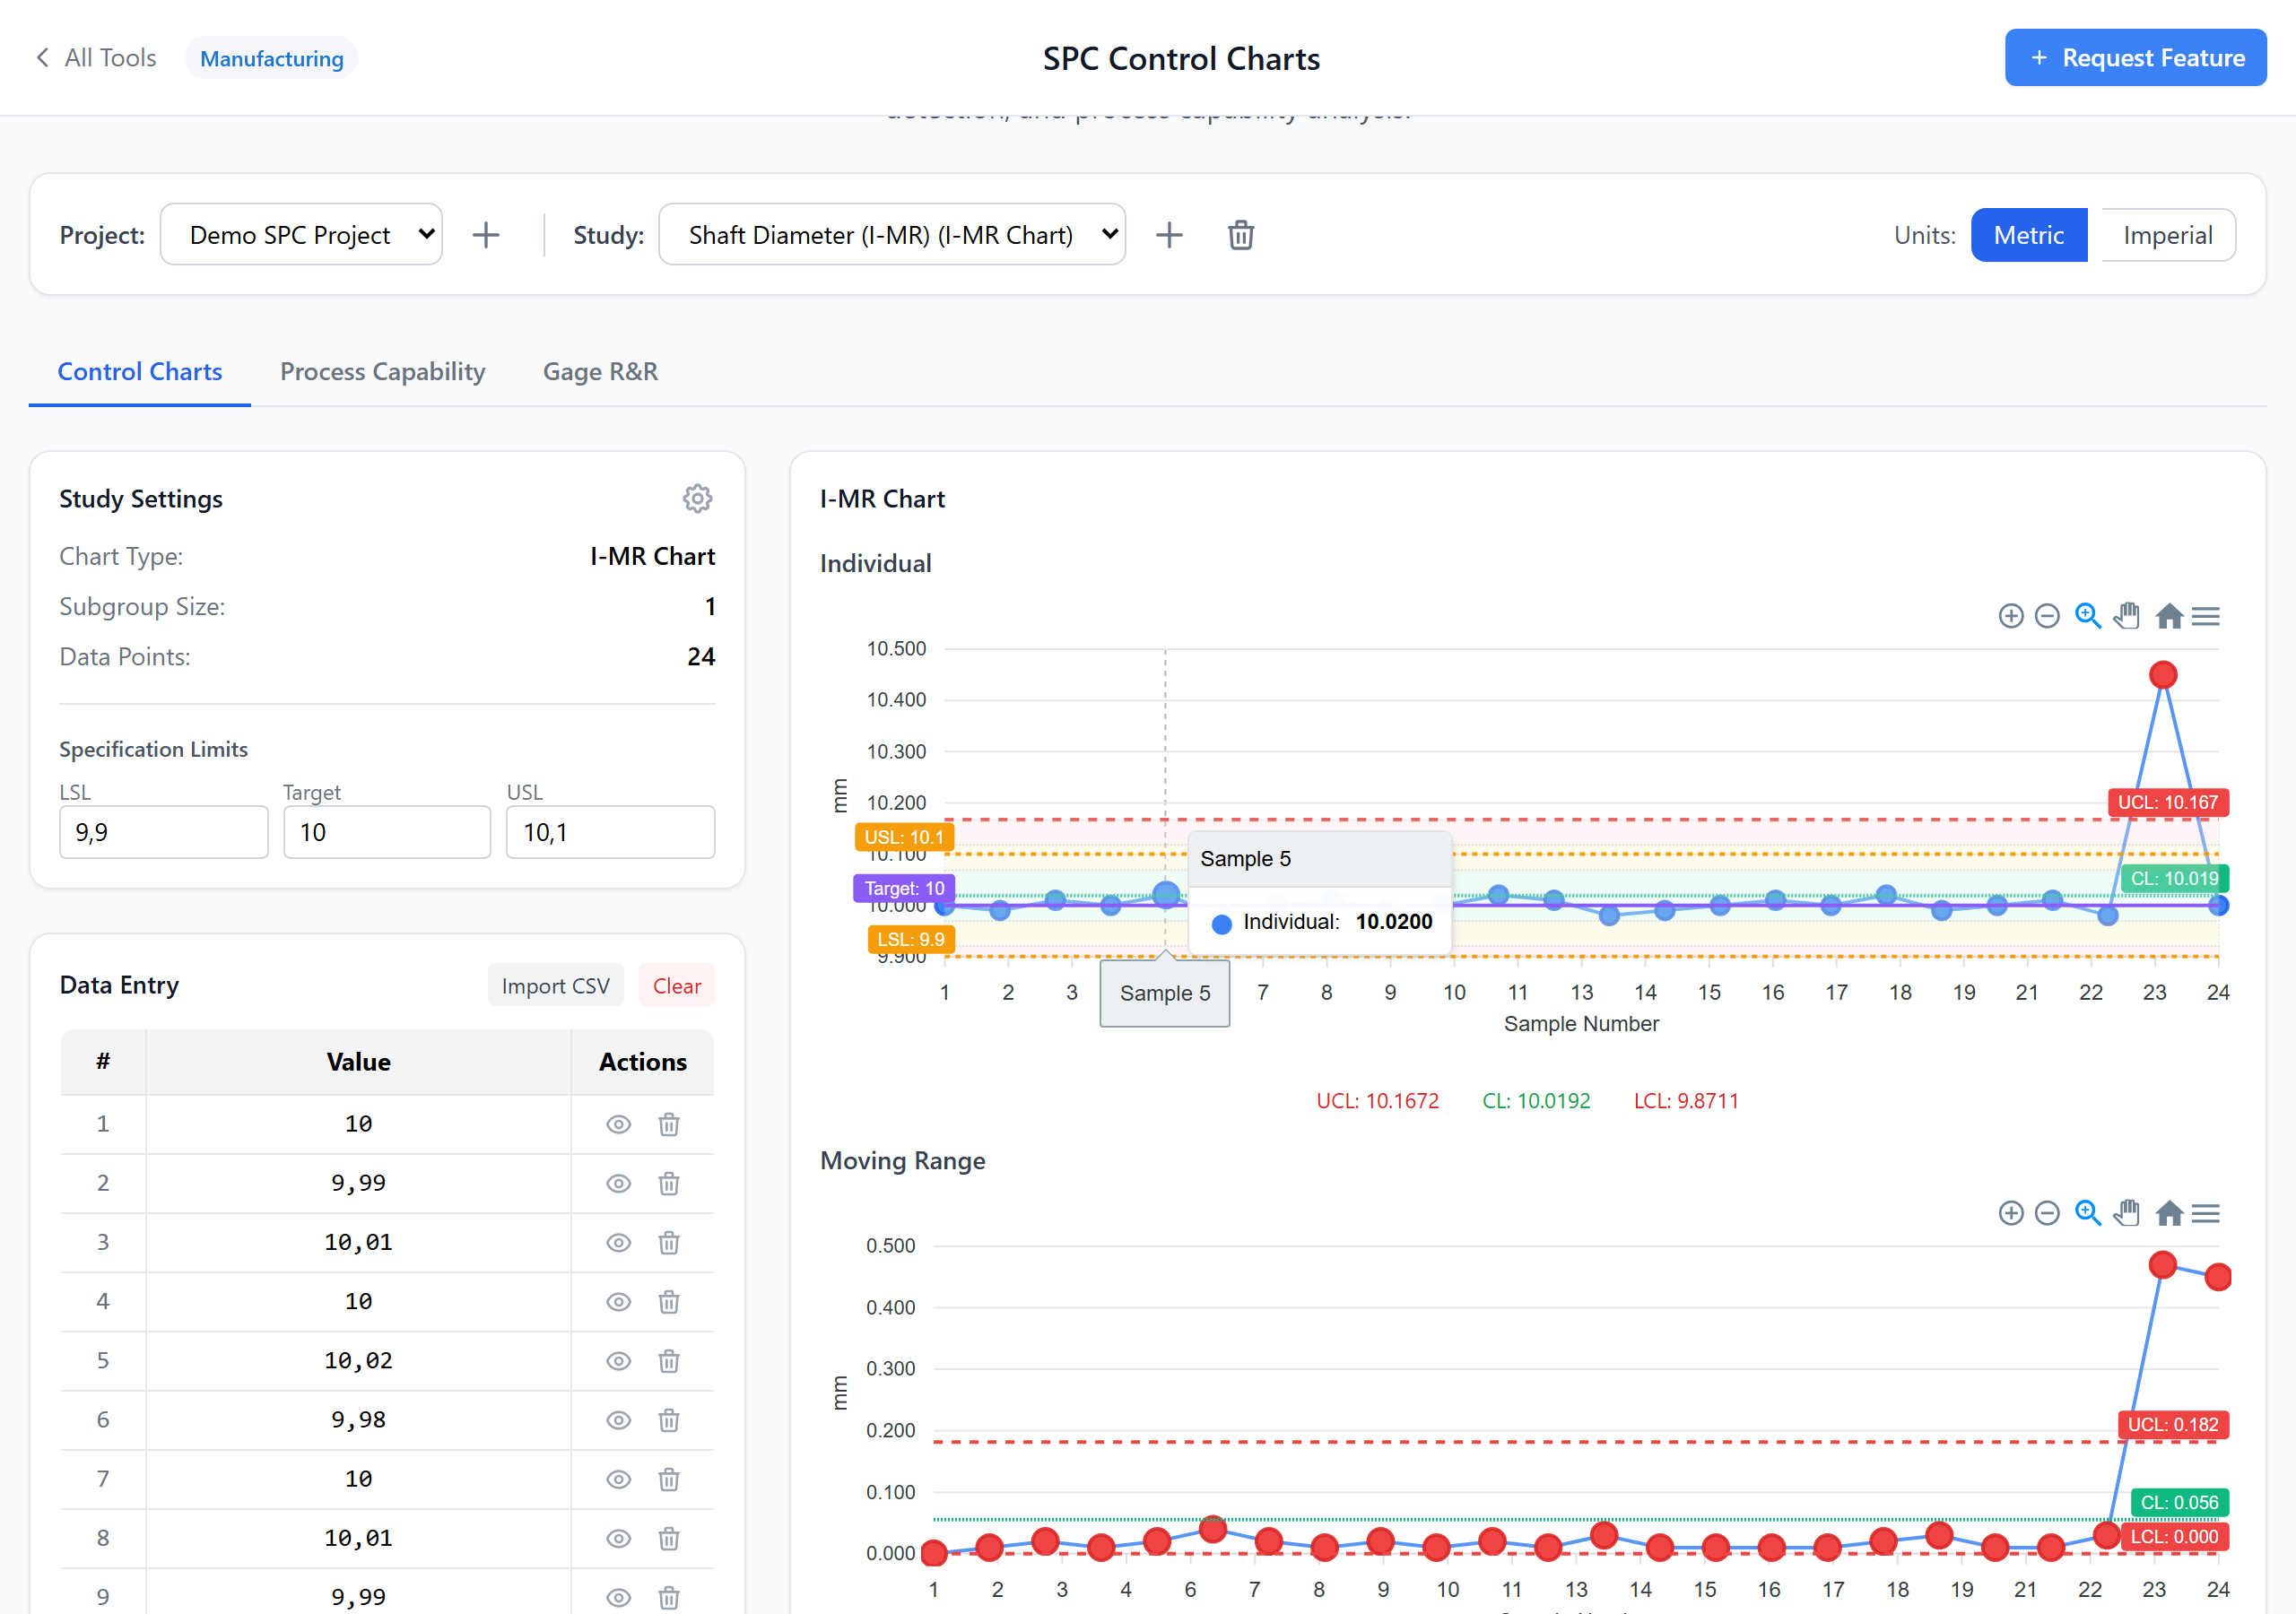
A Real SPC Tool — Not an Excel Template
7 Chart Types
X-bar R (subgroups 2–10), X-bar S (subgroups 2–25), I-MR (individuals), P / NP (defectives), C / U (defects). Right chart for any data type.
Rule Detection
Western Electric and Nelson rules automatically highlight points outside limits, runs, trends, mixtures and oscillation patterns. Stop spotting them by eye.
Cpk / Ppk Capability
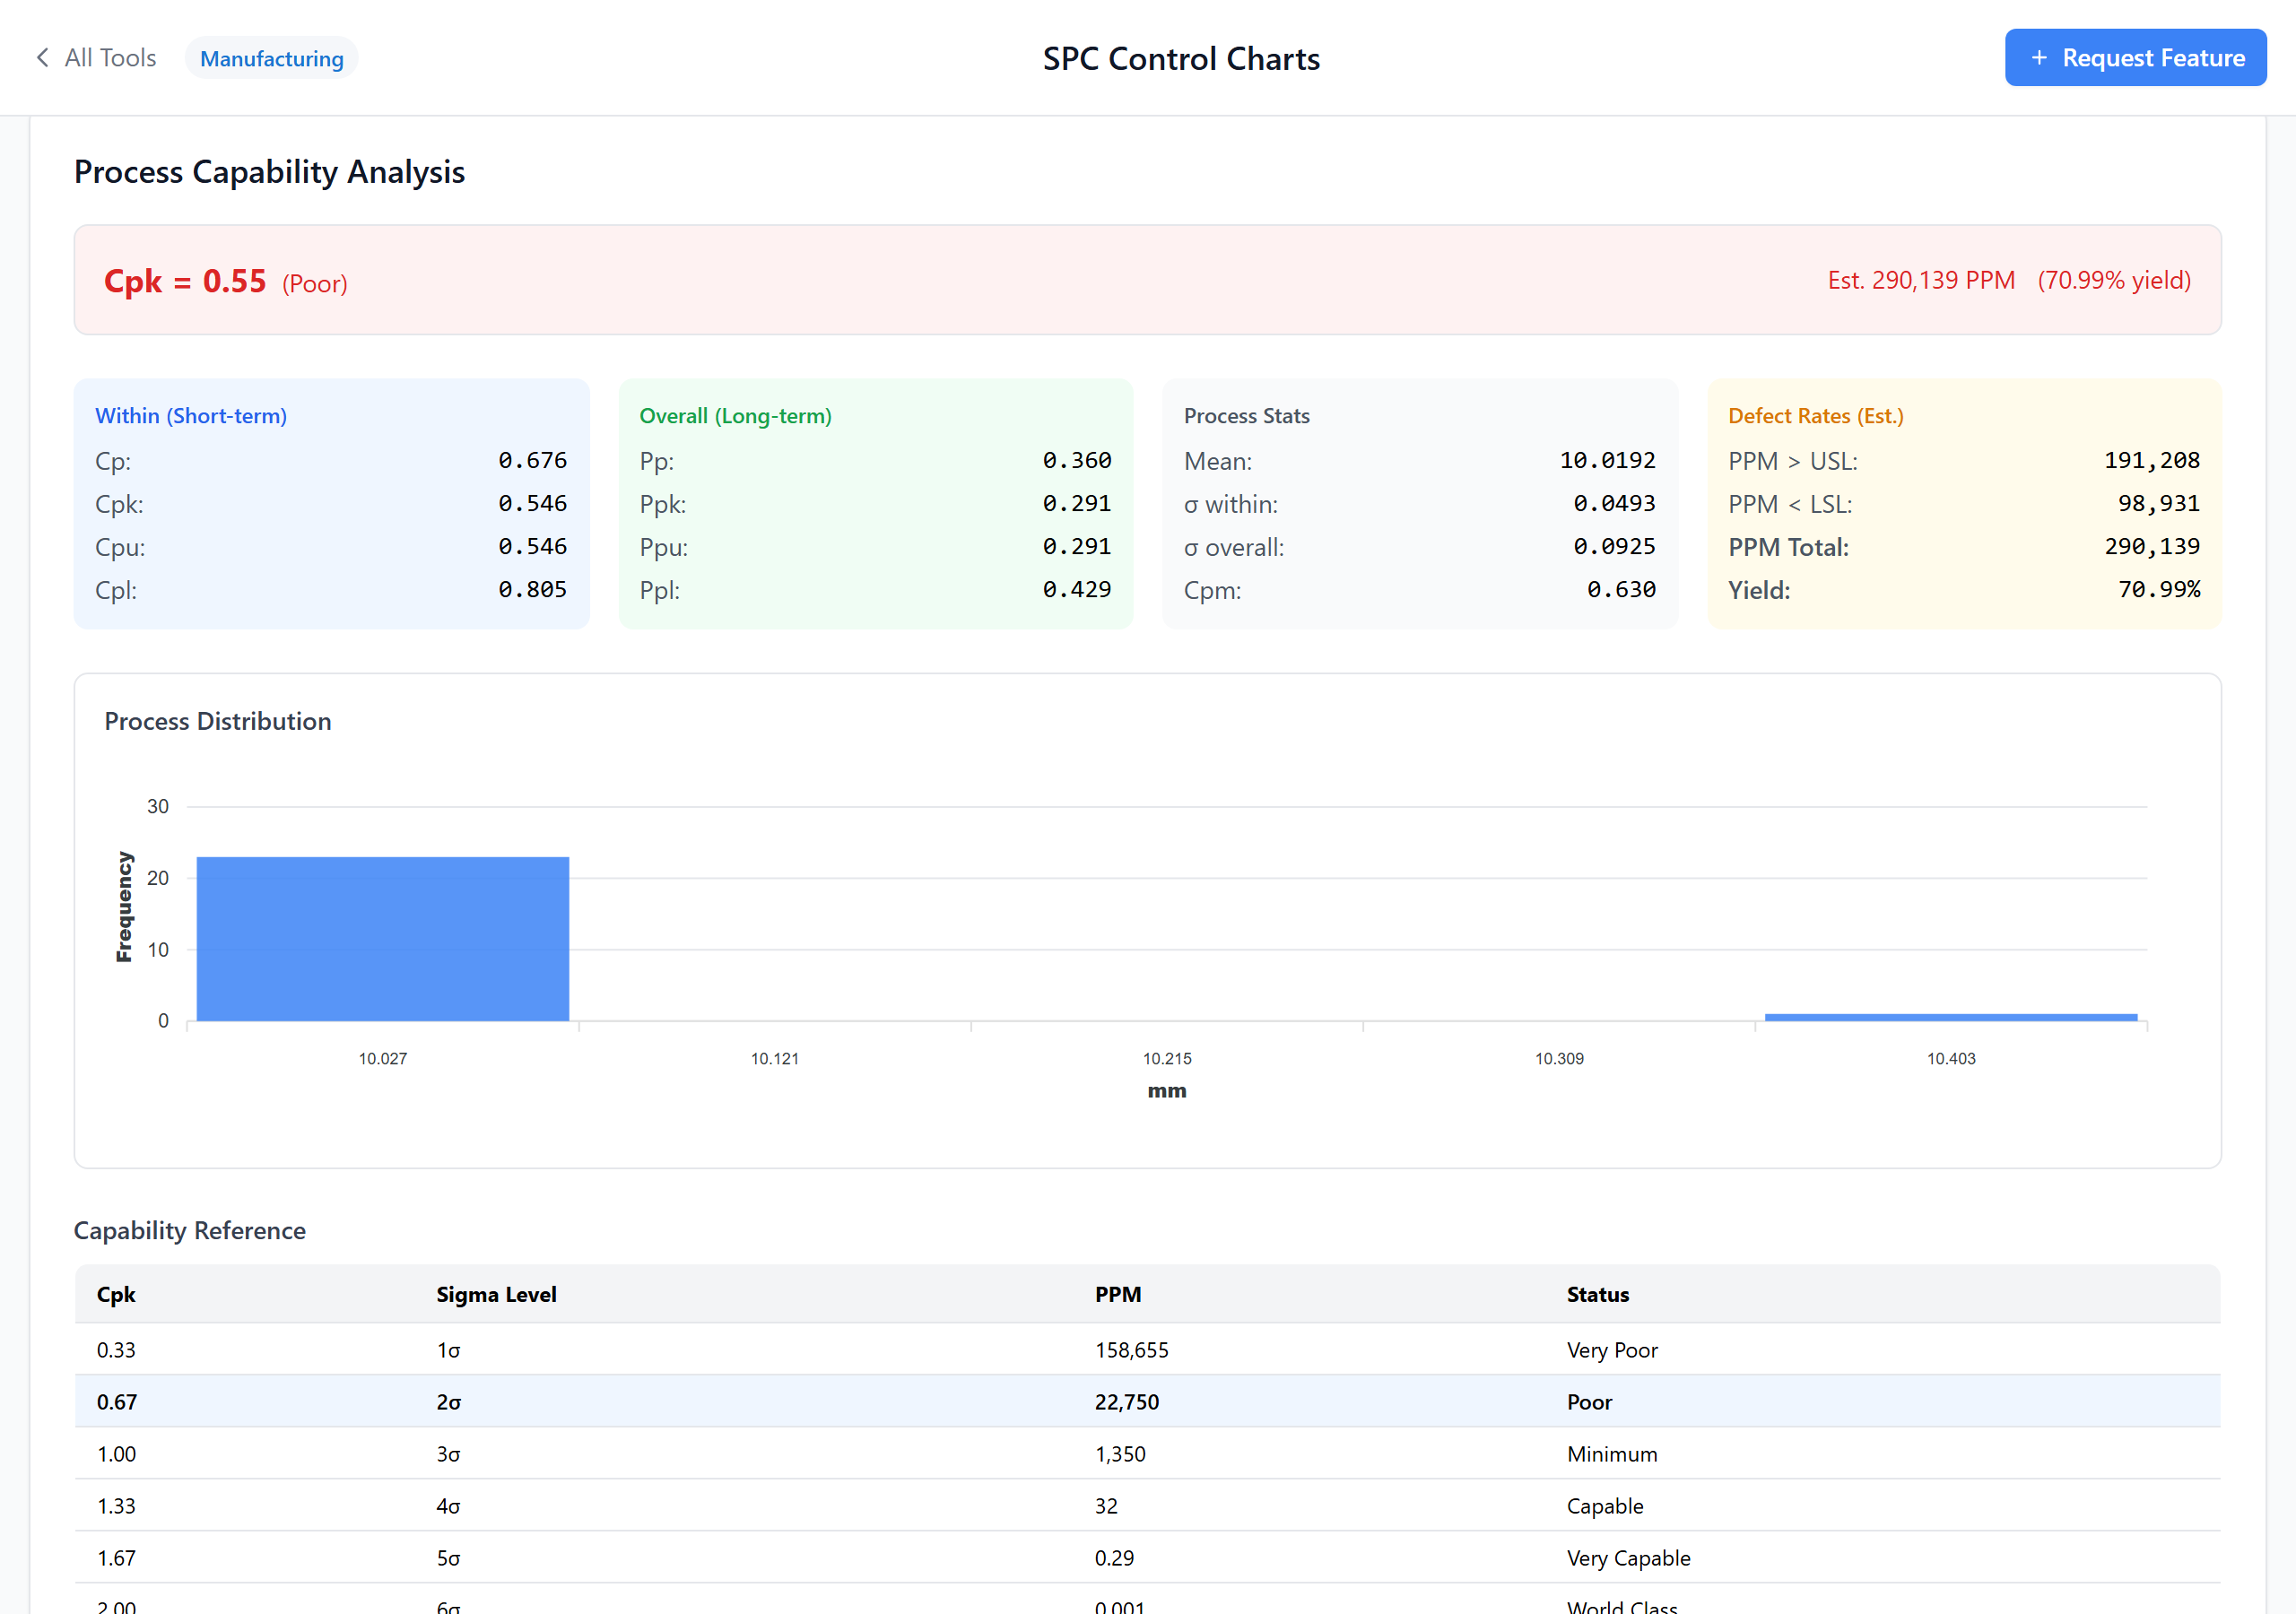
Process capability with Cp, Cpk, Pp and Ppk against your USL / LSL / target. Histograms with spec lines so you can see what is happening.
AIAG Gage R&R
Full Gage R&R study — ANOVA and Average-Range methods, %GRR, NDC, repeatability and reproducibility breakdowns. AIAG MSA-4 compliant defaults.
Import / Export & Multi-Project
Paste data from Excel or import CSV. Group studies into projects (one per part / characteristic). Export a single study, a whole project or your entire workspace to JSON and import it on another computer — move your charts between systems, no lock-in.
Private & Free
Production data stays on your device. No signup, no per-user fee, no Minitab licence. Works offline after the first page load.
Built for Real Quality Workflows
Control Charts With the Right Constants
Pick the chart type that matches your data — variable (X-bar R, X-bar S, I-MR) or attribute (P, NP, C, U) — and the generator picks the right constants (A2, A3, D3, D4, B3, B4, d2, E2…) automatically. Control limits, centre line and zones are drawn correctly for every chart type and subgroup size.
- A2, A3, D3, D4, B3, B4, d2, E2 — all auto-selected
- Three-sigma limits and 1σ / 2σ zone boundaries
- Subgroup sizes 1 to 25 supported
- Variables and attribute charts in one tool
- Phase I / Phase II workflow
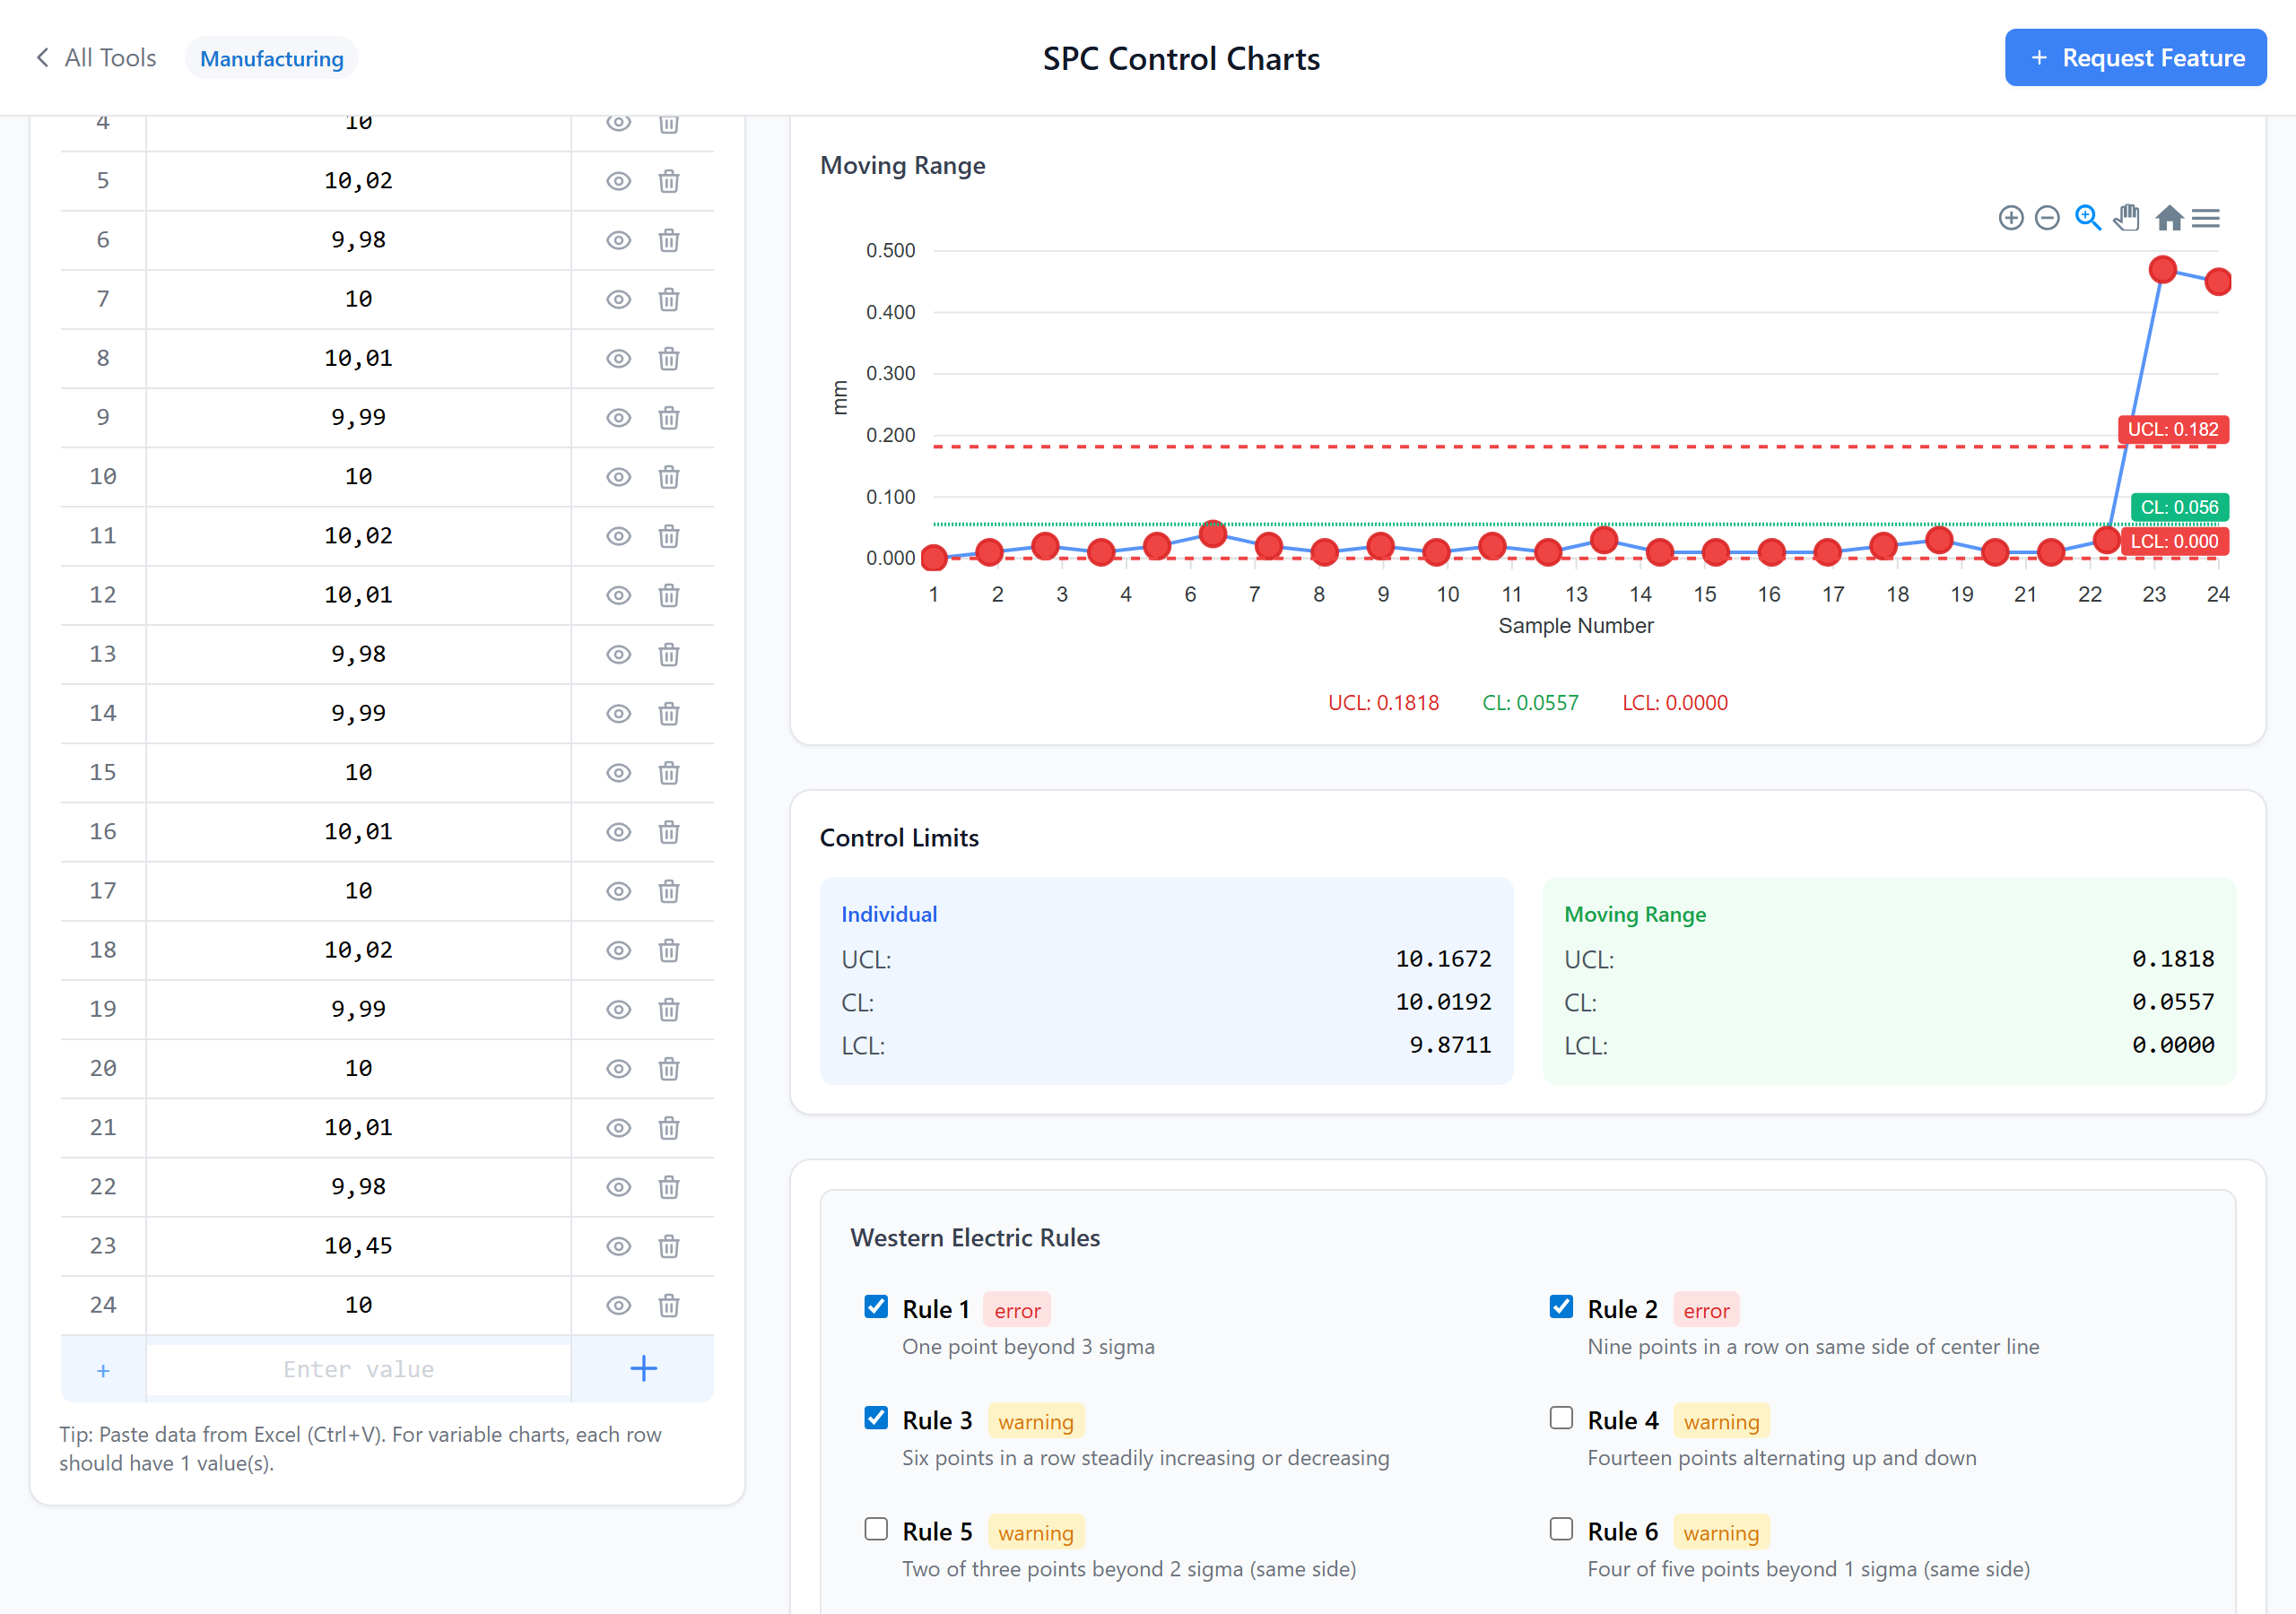
Western Electric & Nelson Rules Highlighting
Every data point is checked against the standard Shewhart rule sets — Western Electric (the original 1956 zone tests) and Nelson 1984. Rule violations are highlighted on the chart and listed in the violations panel so you can investigate special-cause variation immediately.
- Western Electric Rules 1–4 (beyond limits, 2 of 3 in zone A, 4 of 5 in zone B, 8 in a row)
- Nelson Rules 1–8 (trends, runs, oscillation, mixture, stratification)
- Visual highlight on the chart plus violations panel
- Per-rule toggle for noisy signals
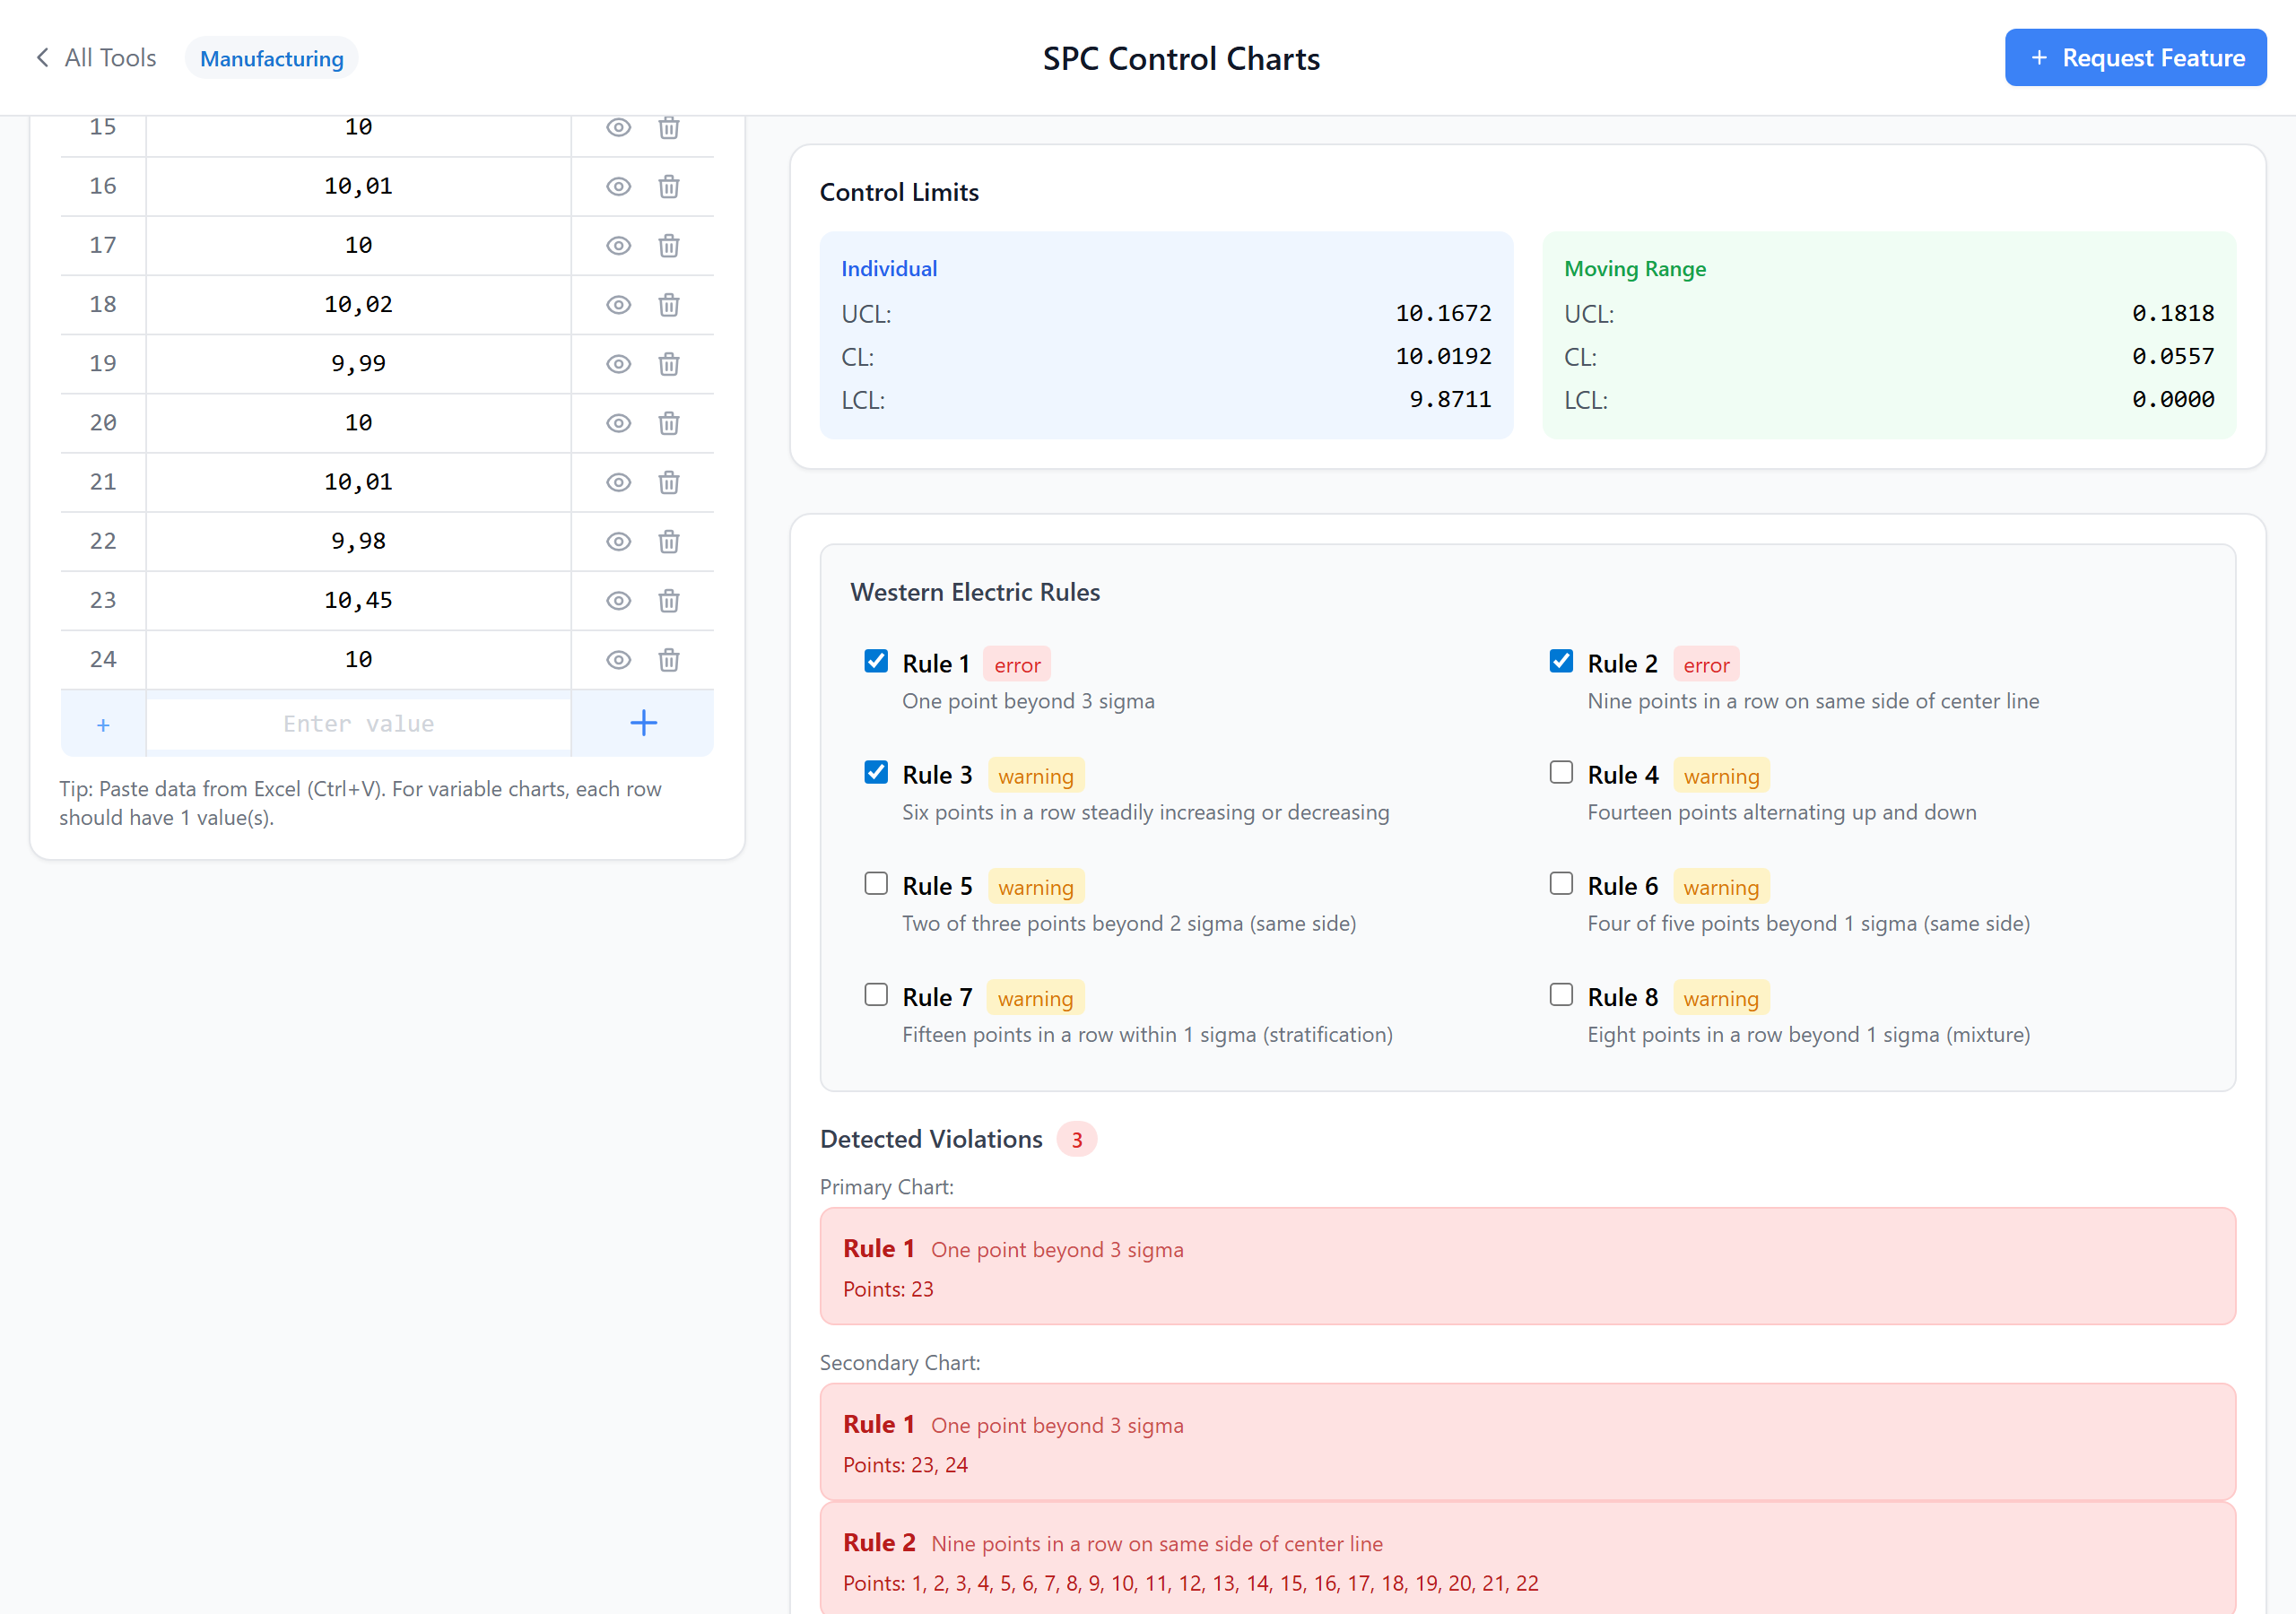
Capability Analysis + Gage R&R
Add USL/LSL/target and the tool computes Cp, Cpk, Pp, Ppk with a histogram overlaid against your spec limits. Separate Gage R&R module handles full measurement-system analysis with ANOVA and Average-Range methods, giving you %GRR, %EV, %AV, %PV and NDC against the AIAG thresholds (< 10 % acceptable, 10–30 % marginal).
- Cp, Cpk, Pp, Ppk against USL/LSL/target
- Histogram with spec lines + normal curve
- AIAG MSA-4 Gage R&R (ANOVA + Average-Range)
- %GRR, NDC, EV / AV / PV breakdown
- Sigma estimate from R-bar/d2 or pooled S
SPC FAQ
• Continuous data (measurements): subgroups of 2–10 → X-bar R. Subgroups > 10 → X-bar S. Individuals (n = 1) → I-MR.
• Pass/fail data (defectives): constant sample size → NP chart. Variable sample size → P chart.
• Defect counts (defects per unit, with multiple defects possible per item): constant area of opportunity → C chart. Variable area → U chart.
When in doubt, pick the chart type that matches how you collect samples — that is what the rules and constants were designed for.
1. One point beyond 3σ
2. Two of three consecutive points in zone A (beyond 2σ)
3. Four of five consecutive points in zone B (beyond 1σ)
4. Eight consecutive points on one side of the centre line
Nelson Rules (1984, Journal of Quality Technology) extend the set to eight rules, adding trend (six rising or falling), 14 alternating, 15 within zone C, 8 outside zone C, and a stratification test. Most modern SPC software defaults to Nelson Rules 1–4 for routine monitoring and adds 5–8 when investigating odd patterns. This tool runs both sets and lets you toggle individual rules so you do not chase false alarms.
Cpk (capability) uses the within-subgroup standard deviation (σ̂ = R̄ / d₂ or pooled S). This represents the process at its best, when only common-cause variation is present. Use Cpk to compare a stable process to spec.
Ppk (performance) uses the overall standard deviation (σ̂ = s of all individual measurements). This represents the process as it actually performed over time, including any drift or shifts. Use Ppk to report what the customer actually experienced.
Rule of thumb: Cpk ≥ 1.33 for ongoing monitoring, 1.67 for safety-critical or PPAP. If Ppk is much lower than Cpk, your process is unstable.
Use this for: routine control charts, Cpk reporting for PPAP, Gage R&R, quick capability checks, training.
Use Minitab/JMP for: DOE, regression modelling, reliability analysis, enterprise audit trails, regulated industries with formal validation requirements.
Many quality engineers use both — this for the daily 80 %, Minitab for the deep 20 %.
Paste the data into the Gage R&R module — the tool runs both ANOVA (recommended) and Average-Range methods and reports:
• %GRR (gauge repeatability + reproducibility as % of total variation)
• %EV (equipment variation), %AV (appraiser), %PV (part)
• NDC (number of distinct categories)
AIAG thresholds: %GRR < 10 % acceptable, 10–30 % marginal (acceptable for low-cost or non-critical), > 30 % unacceptable. NDC should be ≥ 5.
• A2, A3 — used to compute X-bar control limits from R-bar or S-bar
• D3, D4 — used for R-chart limits
• B3, B4 — used for S-chart limits
• d2 — converts R-bar to σ̂ (standard deviation estimate)
• E2 — used for I-chart limits (individuals)
The generator picks the right constant for your subgroup size automatically — you never have to look them up. But knowing they exist helps when you cross-check against another tool.
• X-bar UCL/LCL = X̄̄ ± A₂ × R̄
• R UCL = D₄ × R̄, R LCL = D₃ × R̄ (D₃ = 0 for n ≤ 6)
For an I-MR chart:
• I UCL/LCL = X̄ ± 2.66 × MR̄ (this is E₂ for MR of 2)
• MR UCL = 3.267 × MR̄, MR LCL = 0
Sigma estimate from range data: σ̂ = R̄ / d₂. The constants A₂, D₃, D₄, d₂ depend on subgroup size — the tool handles all of this for you.
Generate Your First Control Chart
Free SPC software with Cpk, Gage R&R and rule detection built in. No signup.
Open the SPC Tool